Interpreting the quantified self
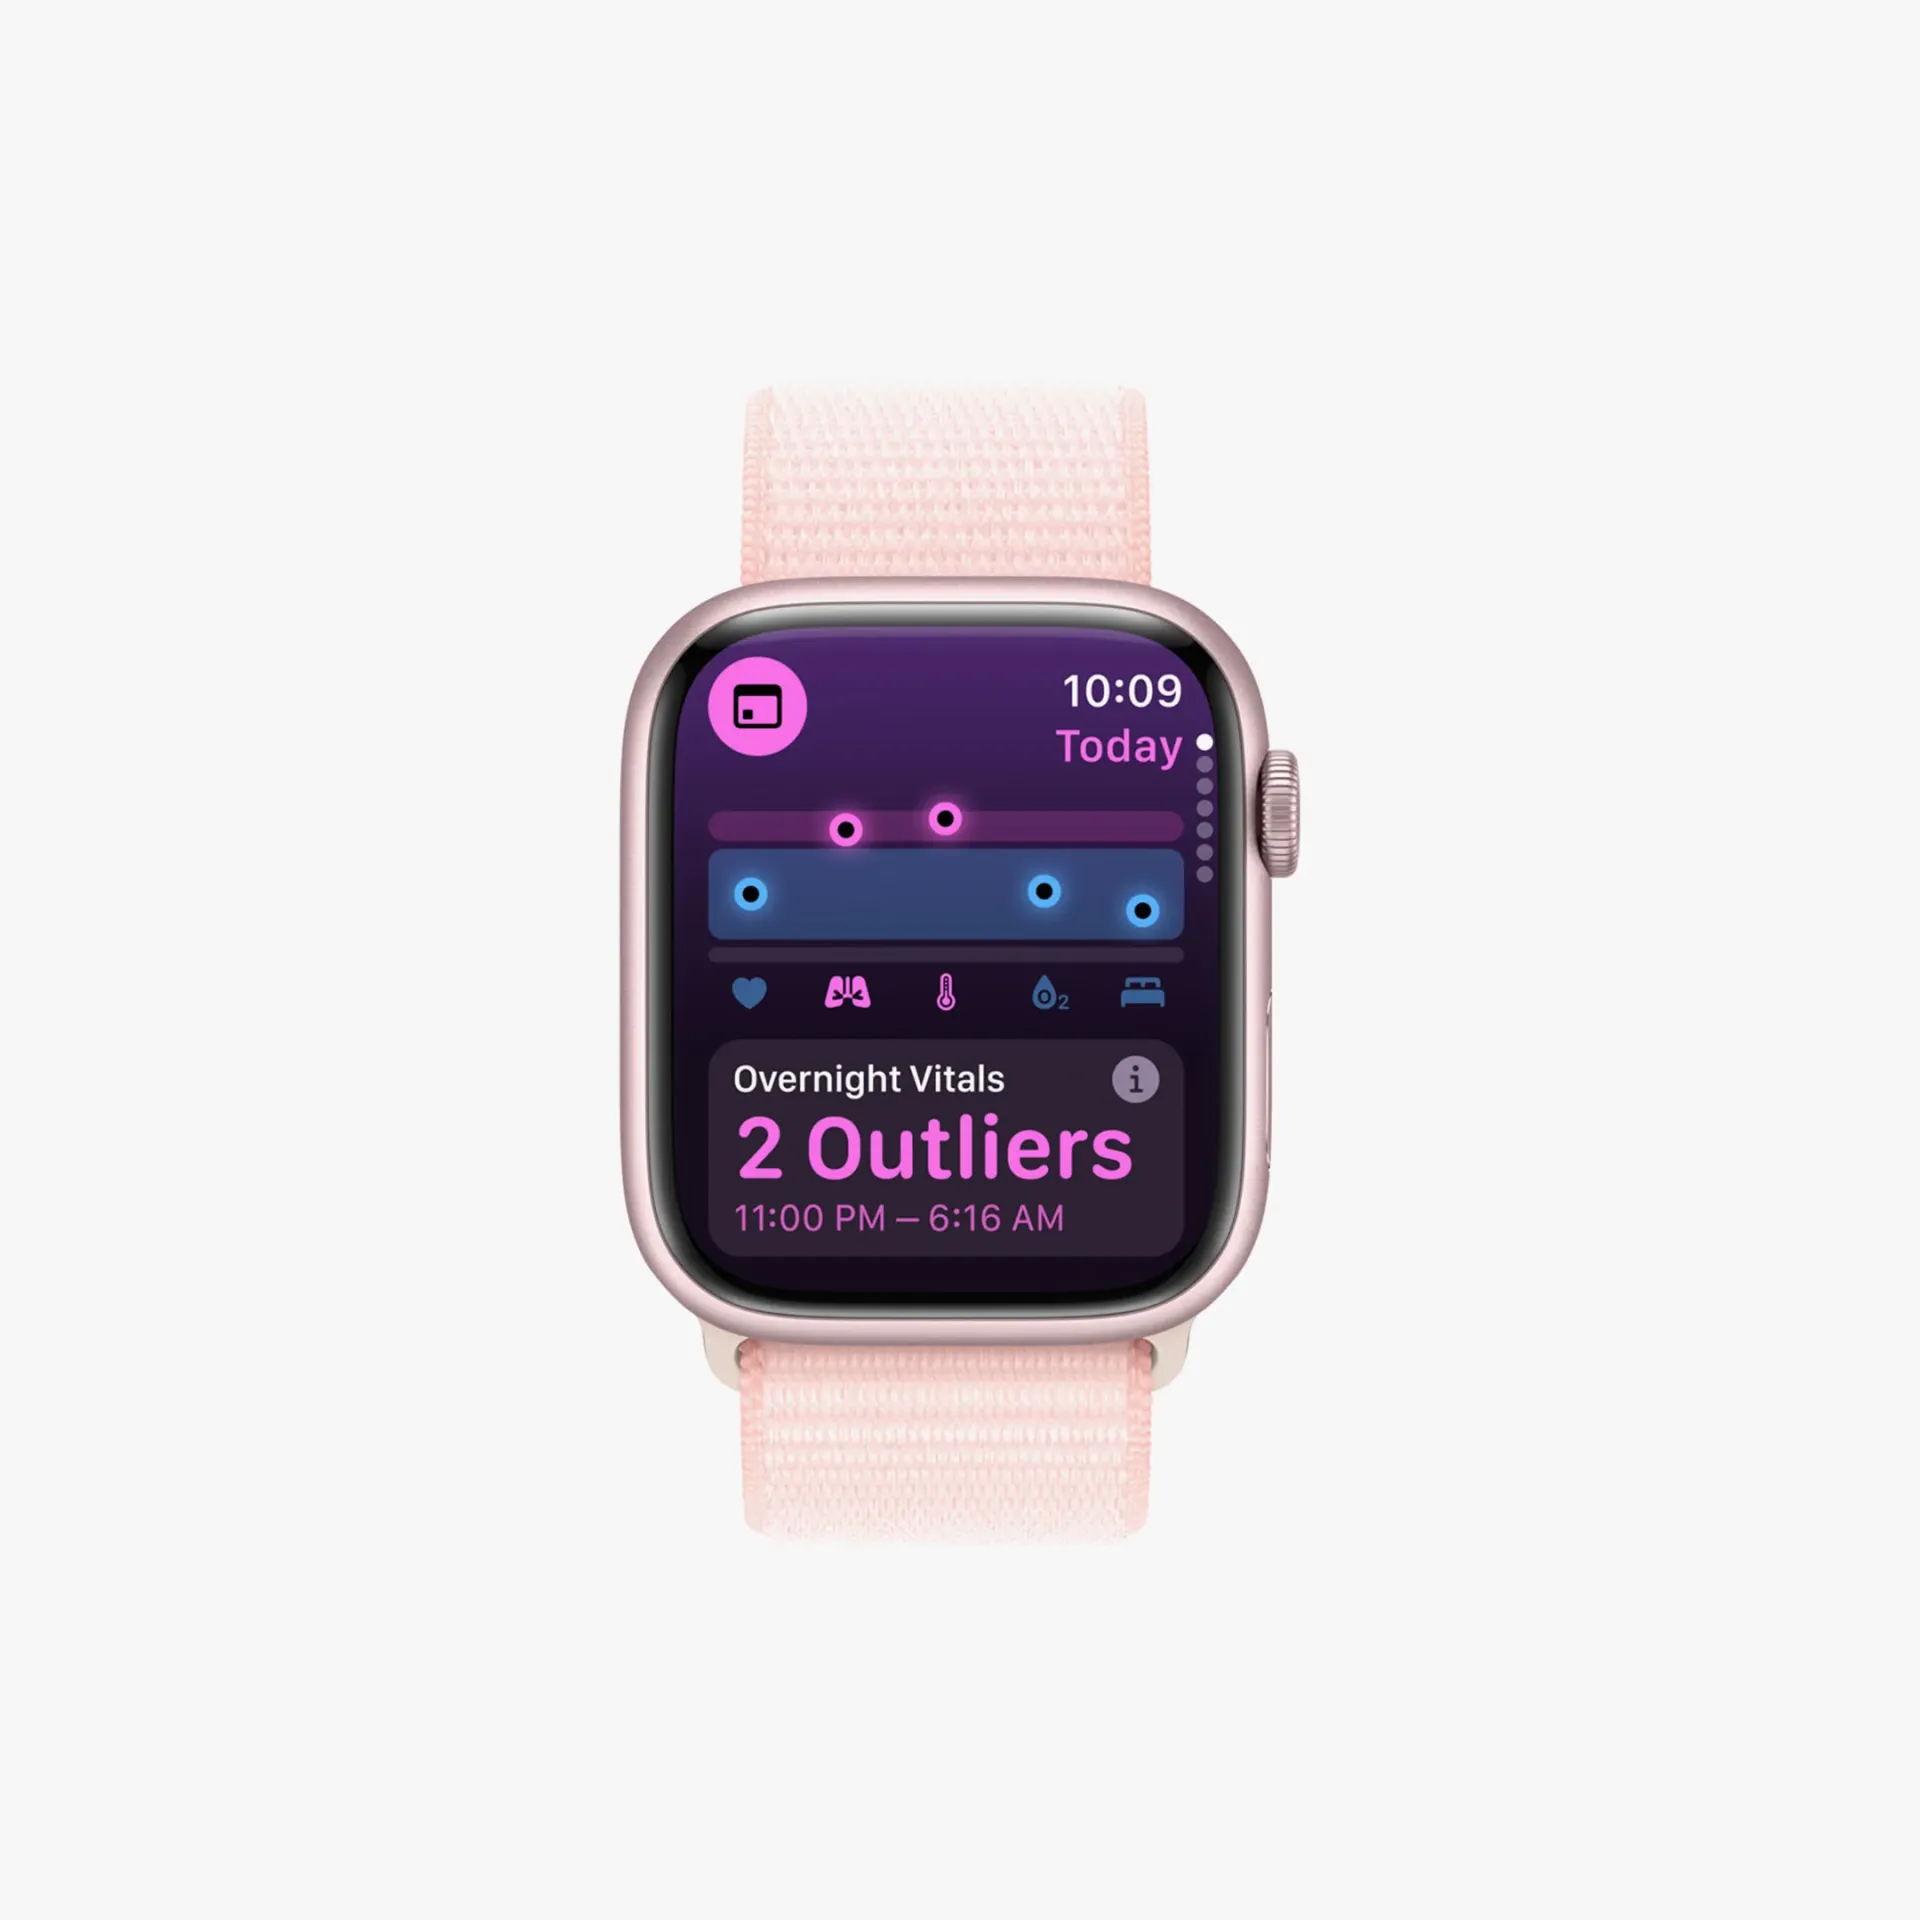 Image: Apple
As is custom, Apple gave a sneak peek into the new features that will come with the new versions of their operating systems later this year at the WWDC. This includes updates to the OS features for the Apple Watch, where a particular bit caught my attention: the Vitals feature (see image above).
The idea for this feature seems to be to provide an overview about the overnight values of heart rate, respiratory rate, (wrist) temperature, sleep duration, and blood oxygen values. If 2 or more values will be outside the “normal” range it’ll inform the wearer about the outliers. According to the news reports I’ve seen, it might also suggest potential “causal environmental features”, but let’s ignore those for a second.
Instead, I want to focus on the idea of uncovering (and then surfacing) the outliers for the individual using the wearable. While the reporting describes those “normal ranges” for the different vital signs as “ideal” parameters, my strong suspicion is that those are not neutral values but rather are centered on the observed normal for each wearer, as each of us will have a different baseline.
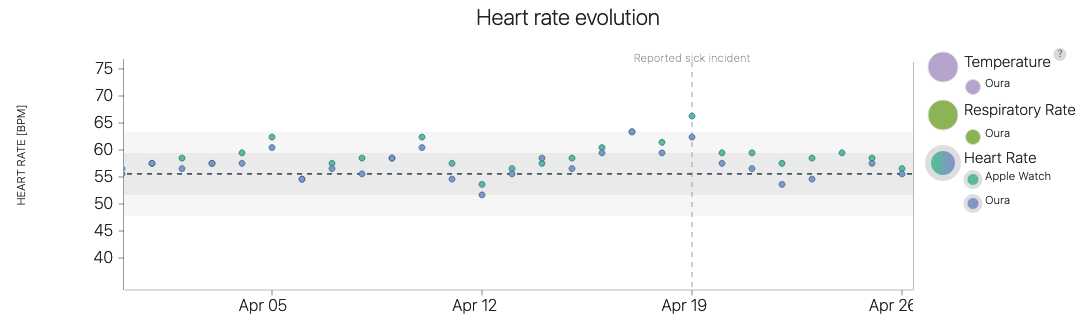 A screenshot of my own Quantified Flu graphs.
This mimicks the individual-centered approach we took back in 2020, when we developed Quantified Flu, which combines manual symptom tracking with physiological data from wearables such as Oura or Apple Watch. Based on the observed data for an individual, we calculated the standard deviations to give people visual feedback for how much their value deviate from their personal normal.
Based on this idea that we developed through Quantified Flu, I also created my own Vitals-like heuristic to provide more insight into my own data. My own heuristic was based on four physiological values: heart rate, respiratory rate, heart rate variability and (finger-measured) body temperature changes. For each of those, I calculated the distribution of observed values to then count how many/how much each of those values deviated from the baseline and validated it with known sickness-days.
The interesting bit to me here is not necessarily that Apple basically uses the same approach for their Vitals app as I made for myself – though, that does feel like some nice external validation - but the point of view that their approach takes (at least implicitly): Quantified Flu and my further heuristic development are rooted in a tradition of Personal Science, in which individuals take a first-person view in trying to understand any data that they collect about themselves. Which (at least to me) means not centering the physiological metrics as the be-all and end-all, but rather recognizing the limitations of such metrics when they are devoid of context.
In particular, this really indicates how central the individual is in making sense of any of these data: All data describing people is limited, and this is particularly true for wearable, sensor-derived physiological data. Is your heart rate elevated because of having an infection? Because of having had a couple of drinks yesterday? Stress at work? Having a broken heart? No sensor will know, but the person wearing the sensor will very easily be able to reason about those numbers[1].
This focus on individual sense-making stands in stark contrast to the tech zeitgeist: ‘AI’ is still everywhere, including in Apple’s own presentation, which of course had to cram their own ‘AI’ solutions into all of their operating systems. In that sense, the Vitals approach highlights a different path that we could be taking - one that does not rely on increasingly complex models that hunger for data, water and energy but instead looks at simple outliers and then uses our own intelligence for making sense of them. In recognition of the fact that situated, personal knowledge is really hard to emulate and outperform.
[1] As a fun aside/anecdote that I never tire of telling: The same is true not only for passively collected sensor-data, but also actively reported data. With Quantified Flu, one person reported a drastic increase of coughing as a symptom alongside heavily increased resting heart rate. All of that would typically indicate an infection. The real reason the person reported in the free-text comment field: They had lost their job due to the lockdowns – and were now sitting at home smoking a lot more than they used to due to the stress.