Measuring app-related stress
tl;dr: Differences in my heart rate depending on the applications I use are small
With France being back in a second lockdown (though the rules are a bit less strict this time around), I thought it would be interesting to look at the impact of different habits a bit more. With most meetings still being remote (or at best being hybrid) – and significant portions of the day being spent in front of a screen regardless of that – I was wondering if using different applications on my computer is stressing me out differently.
There is some literature about how mental stress and different mental tasks can lead to to changes in heart rate1,2. Given that I’m a) running RescueTime – which records the applications I use & when use them – and b) wear an Apple Watch throughout the day – which records heart rate recordings in regular intervals – it should be possible for me to align those records and see if I have a higher heart rates when using some applications.
Merging those records to align individual heart rate records with the recording intervals of RescueTime wasn’t too hard, though it required some decisions about which records to include: As RescueTime bins time into 5-minute long windows and then tells you how many seconds you used a given application within that window I had to figure out under which conditions to associate a heart rate record with a given application. For simplicity, I decided to link a heart rate record with an app usage record if an application was used for more than 1/3rd of the time inside that window, meaning that a single heart rate record can be linked to at most 2 different applications 3.
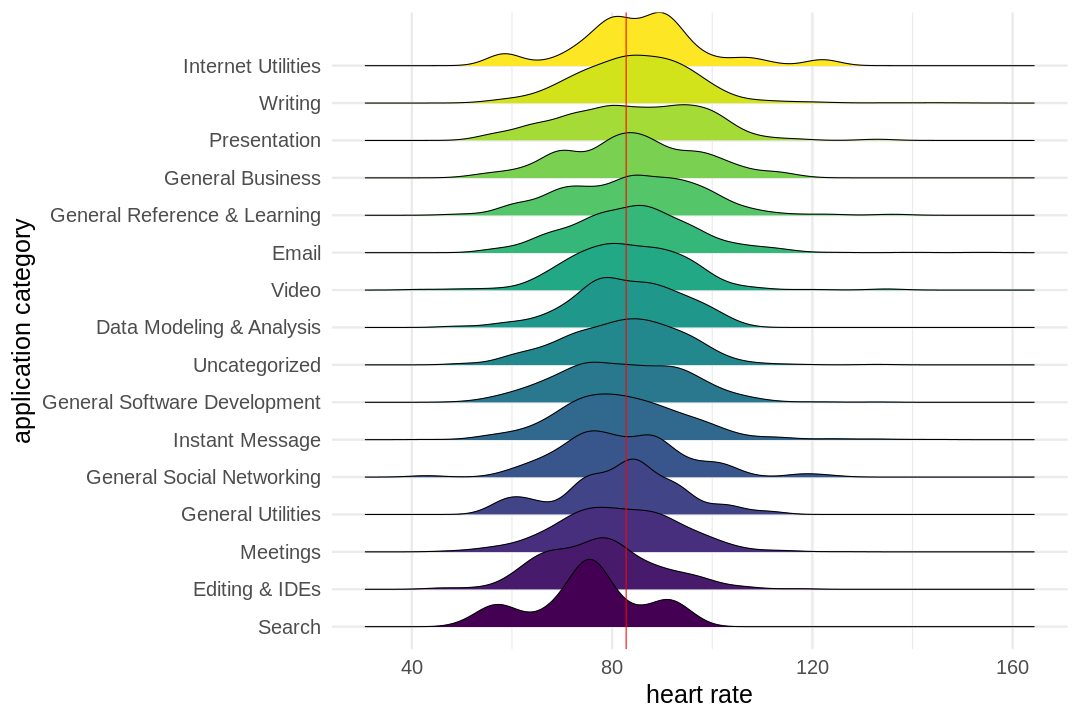
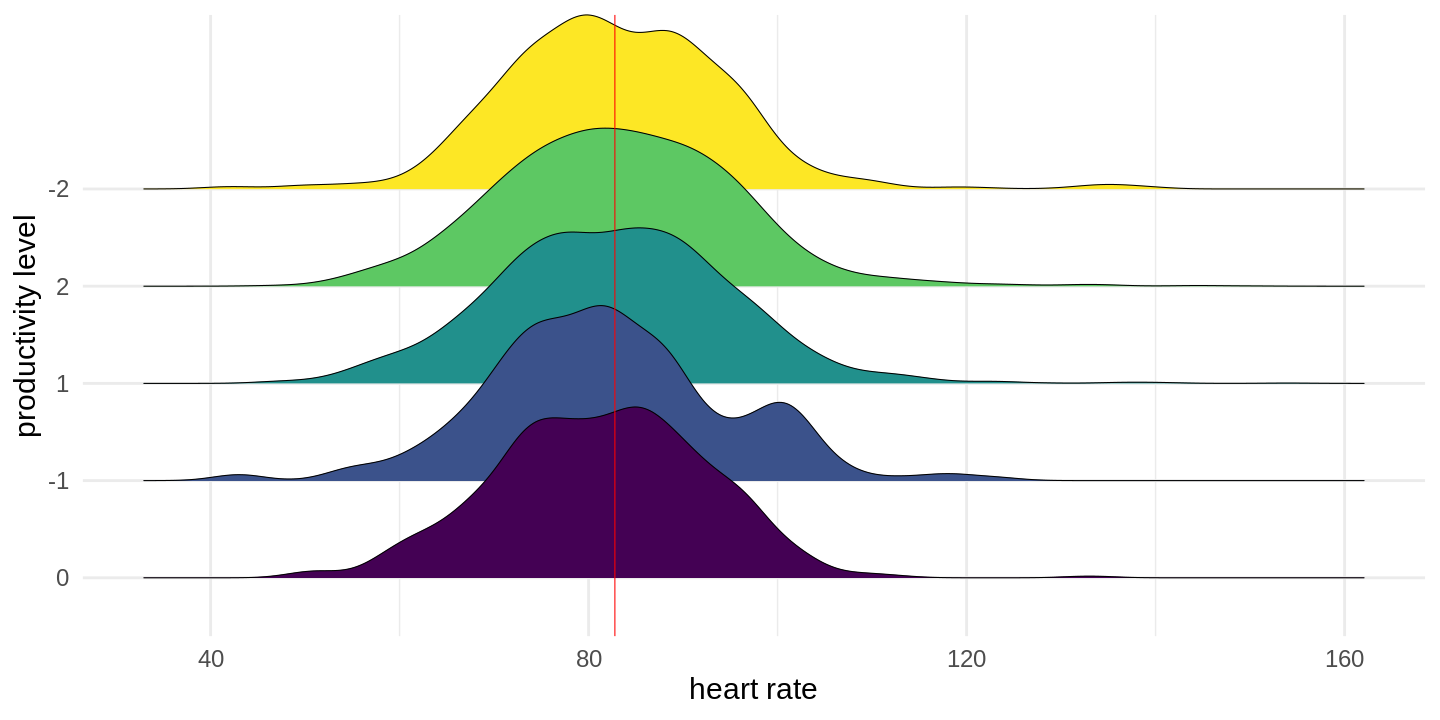
Below you can find the results, broken down into productivity level categories, application categories, and the applications itself 4:
 Red vertical bar gives the average heart rate reading. Click to make larger
On the productivity level, there aren’t a lot of differences to be seen given how similar the distributions are. On the level of application categories the picture isn’t too different, though individual categories like editing & IDEs (aka coding) fall below the average, while others like Presentations seem to fall above the average heart rates.
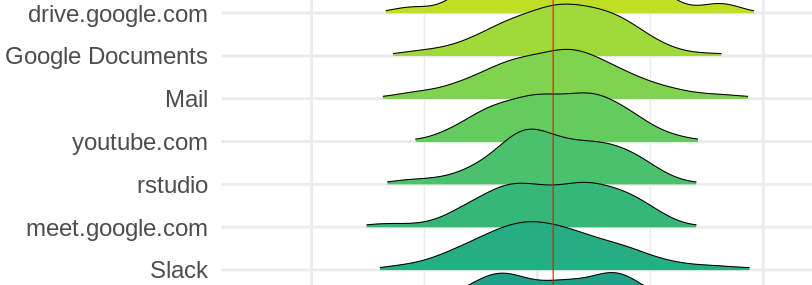
A slightly more interesting picture emerges for the most common individual applications, mostly as the spread is slightly bigger there: Some coding-related applications (like Atom and GitHub) are generally associated with slightly lower heart rates, while others (like RStudio) are showing higher heart rates. Which makes me wonder whether R (mostly written in Rstudio) stresses me out more than Python (mostly written in Atom)? A small hint of this appears in the bi-modal distribution of the notebooks.openhumans.org, which I use to both write Python and R.
A similar bi-modal effect can be seen for preparing & giving presentations in Keynote, which averages to a rather high heart rate. Could it be that the lower heart rate values are for preparing a presentation, while higher values are giving presentations (hello stage fright)?
Another interesting bit: While Netflix scores the highest average heart rate, the VLC Media Player ranks as the application with the lowest average heart rate (amongst the one viewed here), making me wonder what what kind of content I watched in them!
Interested in having a look at your own data? The code for all of this is available so that you can give it a try, happy exploring!
Appendix & Footnotes
You can also find bigger versions of the individual sub-graphs below 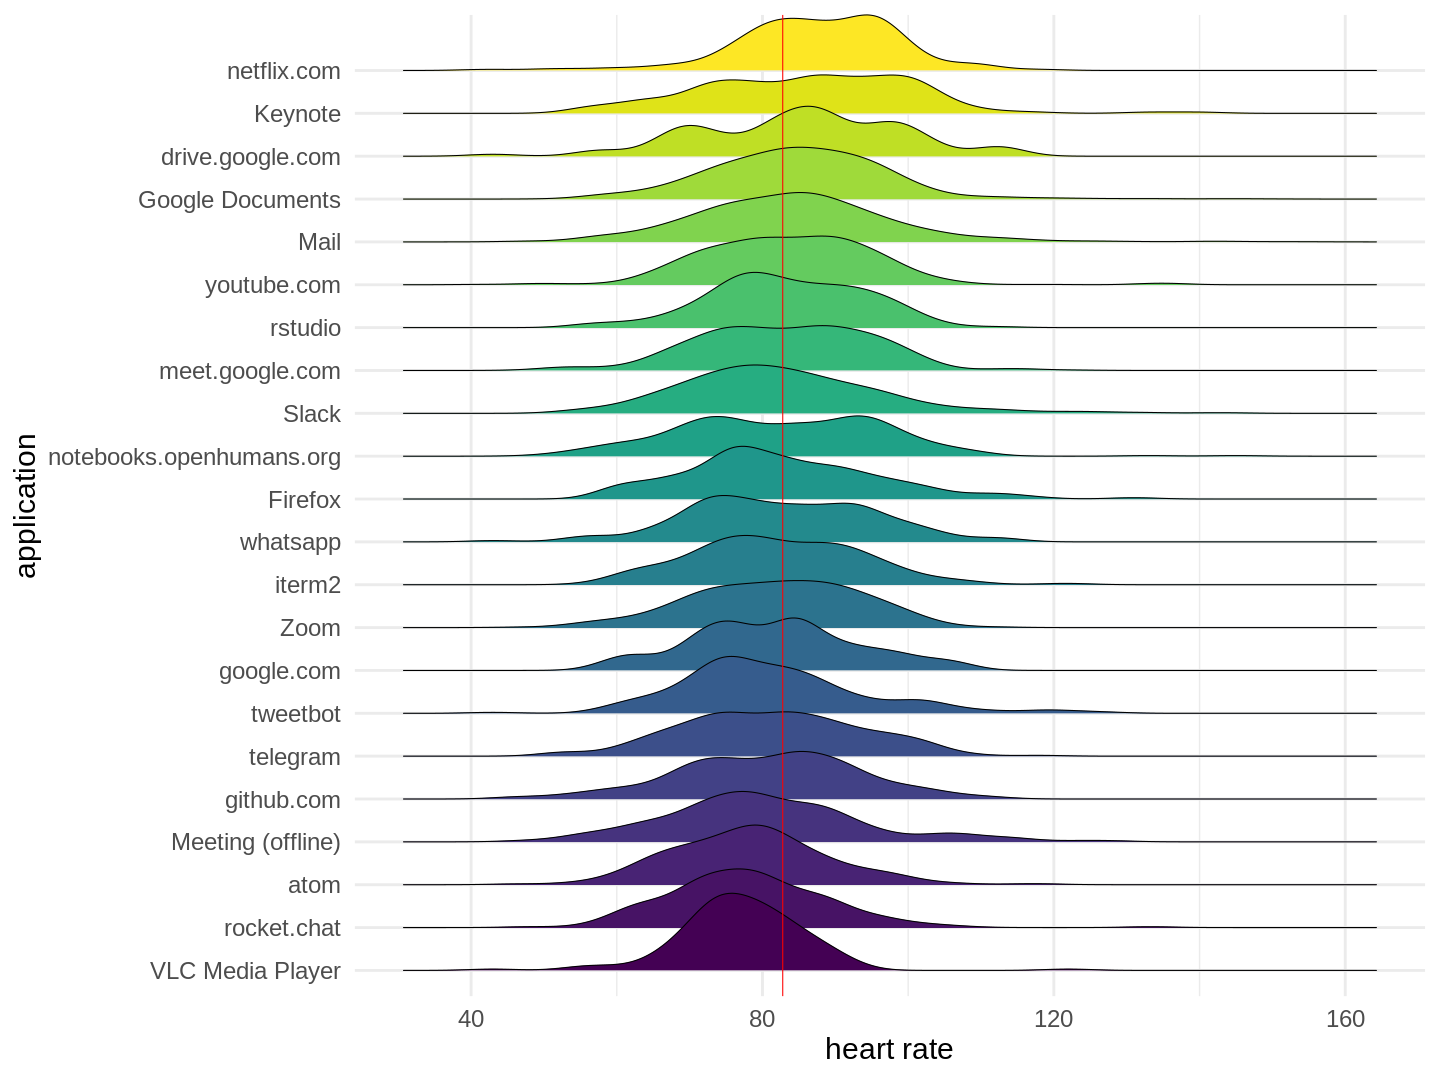
-
Vrijkotte T et al. Effects of Work Stress on Ambulatory Blood Pressure, Heart Rate, and Heart Rate Variability (2000) ↩
-
Taelman J et al. Influence of Mental Stress on Heart Rate and Heart Rate Variability (2009) ↩
-
This is a trade-off between accuracy and the sensitivity. E.g. I could decide to require an application to be used exclusively for the whole 5 minute interval, but due to task switching this rarely happens, leading to a much smaller data basis. ↩
-
Shown are only the applications and application categories that are most-frequent (having at least 8 hours of usage) ↩