On Getting Sleep
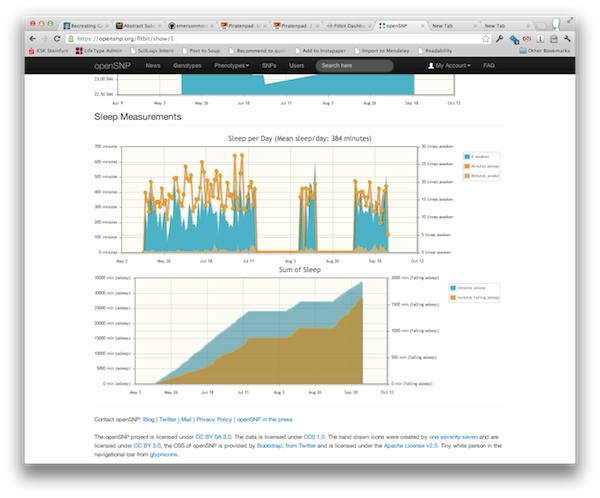
Some of you may have noticed that openSNP now has support for Fitbit. Using OAuth you can connect your Fitbit-account which allows us to mirror the data on openSNP as well. We also have an option for those who don’t feel comfortable sharing all their data: You can select which data categories should be mirrored. Right now those categories are activities (which includes your steps and floors), body (which includes your weight and body-mass-index and sleep (including the number of minutes you slept, how often you awoke in a night and how long those wake-phases were).

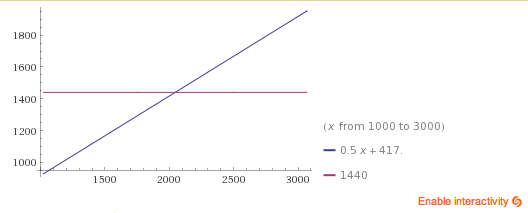
The screenshot should give you a glimpse of how my data set shows up on openSNP. There’s a longer blogpost on the whole issue on the project-blog. What’s maybe even more interesting, is what this data can tell us: Ms. Clarkzilla send me the notice that she believed that there’s an trend towards a longer sleep in my data. So I downloaded my data from openSNP and started playing around with it: I did a simple linear regression over the time series and could indeed find a trend towards more sleep. The regression came out as y = 0.5x + 417, which ± says that for each two days that pass I will sleep a minute longer, which also means that it will be about 2000 days (or 5.5 years) until I will sleep 24 hours a day.

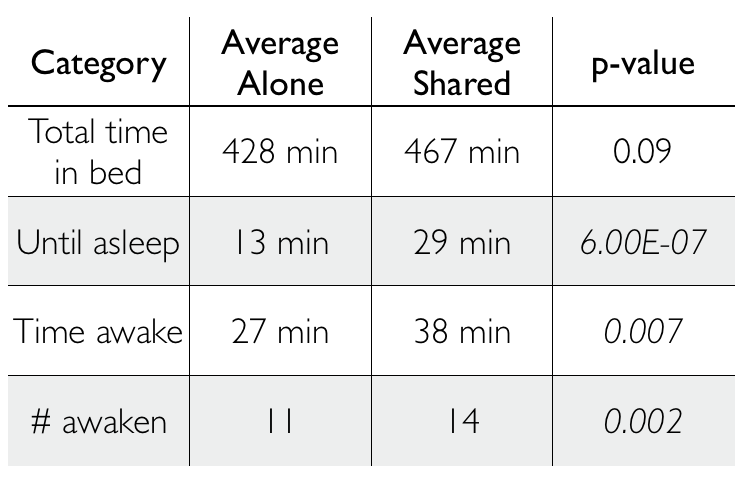
Well, fortunately such linear regressions aren’t the way to go here (No wonder Ms. Clarkzilla asked me whether I learned my skills in Statistics for Social Science). But looking at the data I wondered whether other factors could explain differences in my sleeping data, which not only consists of the total time asleep but also the times I’ve awoken each night and how many minutes I’ve been awake between those sleep-times. One of the factors I thought of first was whether I’ve slept alone or shared my bed. Crawling through my Google Calendar I identified the nights I’ve slept alone and came up with ~60 nights of solo-sleep and ~20 nights during which I shared a bed (95% of those with @senficon).

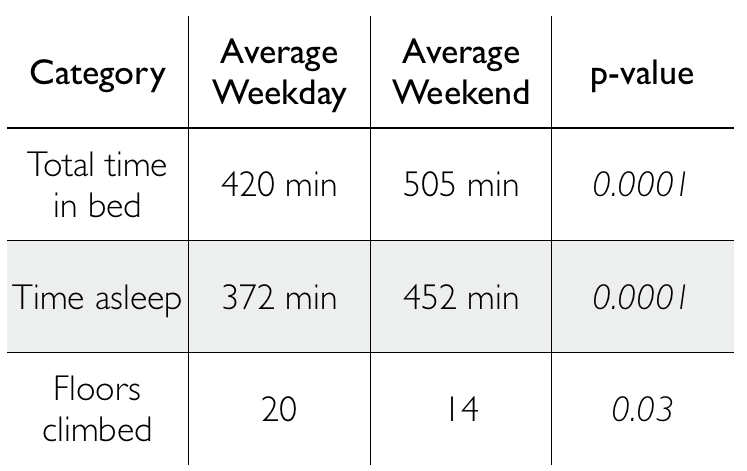
Above you see the some of the average values as well as the p-values, as given by a normal two-tailed t-test. While the amount of sleep I get doesn’t differ between both conditions there are significant differences between other metrics, which Fitbit uses to calculate the sleep quality/efficiency. At first glance it looks like (at least for me) a shared bed is associated with a longer time until I fall asleep. While I awake more often and for longer time frames at the same time. To make sure that this isn’t an artifact due to other factors which also could influence my sleep (maybe the distribution of weekdays and weekends between the two conditions is skewed?) I also had a look into this and binned each night into weekdays and weekends.

There’s no significant difference between the workdays for the alone/shared-conditions (p=0.68) but there are some other nice correlations: As one might expect I tend to get more sleep on weekends and to spent more time in bed in general. But I’m also less active on weekends, at least for the number of floors climbed. Which also makes sense, as workdays are full of using the subway and climbing the floors to my office.
I’ve had a quick look into the scientific literature but until now I couldn’t find any publications which dealt with this issue, although there has some work been done on couples’ nighttime sleep efficiency and concordance and others have shown that the stable presence of a partner is an independent correlate of better sleep quality and continuity in women. So please let me know if you have some links on this.
So what are the preliminary results? Well, it looks like sharing a bed won’t help me to get a better sleep, although I’m not yet sure if this is a unique property of @senficon or a general pattern. So it looks like more research is desperately needed. Collecting more data should be easy enough (if I remember to wear the Fitbit each night), but who else will be willing to volunteer to share a bed with me? If you also want to play around with the data: If you sign up with openSNP you can download the complete data from my profile.
UPDATE 2013 It seems I have to apologize to @senficon. After having gathered enough data it seems she is not to blame, or at least it’s not her person. Also: I shouldn’t have used the t-test but rather a Mann-Whitney test as the data isn’t normally distributed.
Guess I need to apologize @Senficon. Mann–Whitney U gives p > .05 for all three possible comparisons. #quantifiedself pic.twitter.com/ngQwnXDiV3
— Bastian Greshake (@gedankenstuecke) November 6, 2013
